

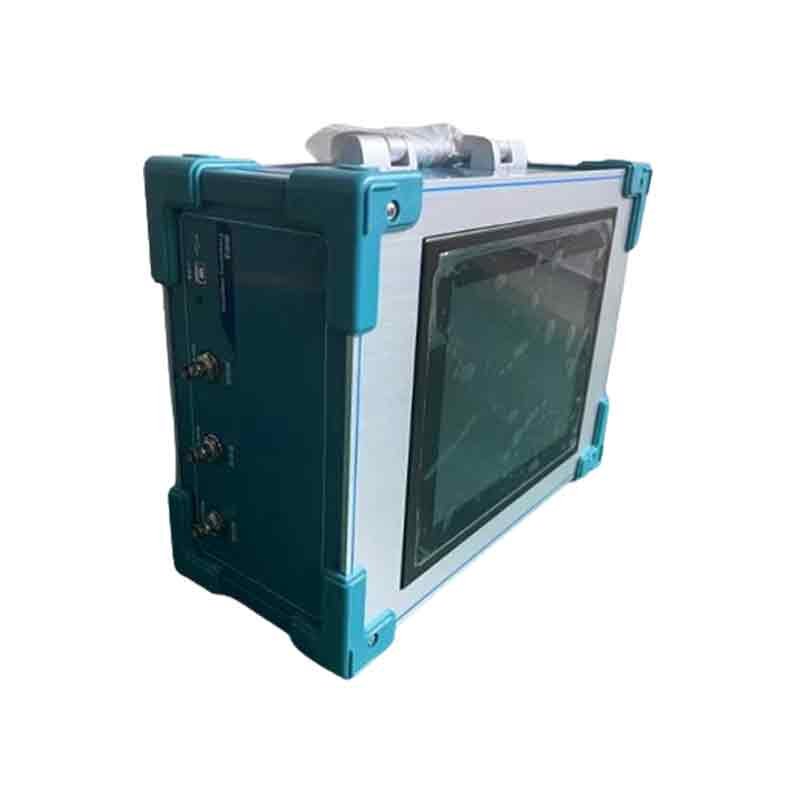
When a transformer has survived transport, a short-circuit event, or years of service, a clean external inspection cannot prove that its windings have remained mechanically stable. If the SFRA instrument, leads, test state, or baseline is poorly controlled, the resulting trace may create uncertainty instead of reducing it. Buyers therefore need specifications that support repeatable measurements—not impressive numbers without a defined test method.
A suitable SFRA analyzer should provide adequate frequency coverage, measurement span, repeatable connections, controlled impedance, traceable output settings, and practical test time. For the KVRZ-S, it specifies 10 Hz–10 MHz linear sweep capability, a −120 dB to +20 dB amplitude range, 50 Ω output impedance, and less than 60 seconds per phase.
The best purchasing decision comes from separating three questions: what the product manual actually states, what the applicable standard requires, and what must still be verified with the supplier. The following sections apply that discipline to the KVRZ-S Sweep Frequency Response Analyzer from KV HIPOT.
What Is the Standard Frequency Range for an SFRA Tester?
A quoted frequency range can look decisive while hiding the details that affect usable data. Buyers may discover too late that the advertised endpoints apply only to one sweep mode, that point spacing changes across the range, or that the highest frequencies are not repeatable with the supplied leads.
There is no single frequency range that alone proves an SFRA tester is suitable. The KVRZ-S specifies 10 Hz–10 MHz for linear sweep and 0.5 kHz–1 MHz for segmented sweep. Buyers should also compare point count, frequency spacing, lead setup, repeatability, and the range required by their test procedure.
What does the KVRZ-S actually specify?
The manual lists two operating modes. In linear sweep mode, it states a range of 10 Hz to 10 MHz, up to 40,000 measurement points, and selectable frequency resolution of 0.25 kHz, 0.5 kHz, or 1 kHz. In segmented sweep mode, it states 0.5 kHz to 1 MHz with 2,000 points divided among four frequency bands. The software instructions also indicate that the end frequency can be set from 600 kHz to 2,000 kHz in the described interface; 0.25 kHz and 0.5 kHz steps are limited to an end frequency of 1,000 kHz or below, and logarithmic distribution is described with a 1,000 kHz end point.
| Item | KVRZ-S value | Buyer interpretation |
|---|---|---|
| Linear sweep range | 10 Hz–10 MHz | Broad stated instrument capability; verify the exact software configuration supplied |
| Linear sweep points | Up to 40,000 | Supports dense acquisition, but more points also increase acquisition and file-management demands |
| Linear resolution | 0.25/0.5/1 kHz | Confirm which resolution is available at the selected end frequency |
| Segmented sweep range | 0.5 kHz–1 MHz | The defined four-band workflow in the manual |
| Segmented sweep points | 2,000 | Designed for structured comparison across low, medium, and high-frequency regions |
| Sweep-frequency accuracy | 0.01% | A stated instrument specification that should be confirmed in the quotation and calibration documentation |
Do not replace these values with a generic “20 Hz–2 MHz IEC range.” IEC 60076-18 is a measurement standard, not a marketing shortcut. It addresses frequency selection, measurement spacing, setup, equipment performance, and records; the useful diagnostic range can also be limited by the transformer, the connection arrangement, noise, and repeatability. For a tender, specify the required sweep mode, start and stop frequencies, point distribution, export format, and a repeatability demonstration using the supplied leads.
Why Is a Measurement Span of at Least 140 dB Important in SFRA Equipment?
Transformer responses may include deep attenuation and sharp resonances. If an analyzer reaches its noise floor in these regions, genuine winding information can disappear or become unstable. However, buyers should not accept a large “dynamic range” number unless the supplier defines how it was measured and over which frequencies it remains usable.
The KVRZ-S lists an amplitude range from −120 dB to +20 dB, a total span of 140 dB. This wide stated span can help capture highly attenuated response regions, but it should be described as an amplitude measurement span unless a documented dynamic-range test method and signal-to-noise criterion are provided.
How should a buyer evaluate the 140 dB figure?
The 140 dB calculation is straightforward: +20 dB minus −120 dB equals 140 dB. The terminology is more important. The Chinese manual labels this specification as an amplitude measurement range. It does not provide, on the same specification page, a dynamic-range test circuit, frequency-dependent curve, noise-floor definition, or minimum signal-to-noise ratio. The defensible statement is therefore “140 dB amplitude measurement span,” not an unqualified claim of IEC-certified dynamic range.
IEC 60076-18 gives a useful procurement benchmark: the measuring instrument’s minimum dynamic range extends from +10 dB to −90 dB relative to the voltage source’s maximum output signal, with at least a 6 dB signal-to-noise ratio across the whole frequency range. This is a 100 dB minimum span under a defined condition. A product may advertise a larger number, but conformity depends on the complete requirement and test evidence—not subtraction alone.
| Evaluation question | Why it matters | What to request from the supplier |
|---|---|---|
| Is the figure an amplitude range or verified dynamic range? | These terms are not automatically interchangeable | Written definition and test method |
| Is the noise floor stable across frequency? | High-frequency and deep-notch data may be noise-limited | Open-circuit/noise-floor trace over the claimed range |
| What accuracy applies at high attenuation? | A 0.1 dB headline may not apply uniformly down to −120 dB | Accuracy table versus level and frequency |
| Is the result repeatable after disconnecting and reconnecting leads? | Repeatability is essential for comparison-based diagnosis | Reconnection repeatability demonstration |
Why Must SFRA Measurement Leads and Channels Use Matched Impedance?
At higher frequencies, a test lead is part of the measuring circuit rather than a transparent wire. An impedance discontinuity can reflect energy, shift resonances, or change attenuation. The resulting trace difference may look like winding movement even when the transformer itself has not changed.
IEC 60076-18 requires the response measurement to be made across 50 Ω. When coaxial measurement leads are used, the reference and response channel input impedances must be 50 Ω ±2% across the full frequency range, and the leads must be matched so reflections do not materially influence the measurement.
Does the KVRZ-S prove a fully matched 50 Ω measurement path?
No. The manual states that the measurement unit connects to the transformer through 50 Ω high-frequency coaxial cable and lists the instrument’s output impedance as 50 Ω. However, its technical table lists the input impedance as 1 MΩ. That is not the same as the IEC requirement for 50 Ω ±2% reference and response channel inputs when coaxial measurement leads are used.
This discrepancy does not prove that the instrument cannot produce useful DL/T-based measurements; it means the available manual does not support a claim of full IEC 60076-18 impedance conformity. There may be an external termination, internal switching arrangement, translated specification error, or another design explanation, but it must be documented rather than assumed.
| Signal-path element | KVRZ-S | IEC-oriented procurement check |
|---|---|---|
| Source/output | 50 Ω output impedance | Confirm across the full claimed frequency range |
| Measurement cable | 50 Ω high-frequency coaxial cable | Confirm characteristic impedance and supplied cable type |
| Input | 1 MΩ | Ask whether reference/response channels include a selectable or external 50 Ω termination |
| Reference and response channels | Dual-channel 16-bit A/D; no 50 Ω ±2% statement located | Request channel-impedance tolerance versus frequency |
| Earthing | Shielding and reliable grounding emphasized | Demonstrate short, repeatable earth connections and continuity checks |
For field acceptance, ask the supplier to connect the source, reference, and response channels together and demonstrate a stable near-0 dB trace across the intended range. Then disconnect and reconnect the complete lead set and repeat a transformer phase measurement. The second trace should closely overlay the first. This practical check is often more valuable than a cable label because it tests the delivered analyzer, leads, connectors, grounding method, and software as one system.
What Output Voltage Levels Are Used During an SFRA Sweep?
Output voltage affects signal-to-noise performance, but a higher number is not automatically better. More importantly, “peak,” “peak-to-peak,” and RMS are different quantities. If a quotation changes units without showing the waveform definition and load condition, two apparently similar specifications can differ by a factor of two or more.
The available KVRZ-S manual contains two conflicting output-amplitude statements: a software-adjustable maximum peak amplitude of ±10 V in the feature section and ±20 V in the technical table. Buyers should obtain written confirmation of the delivered model’s peak, Vpp, RMS, waveform, frequency dependence, and load condition.
How should the conflicting values be converted and specified?
For a symmetrical sine wave centered on zero, an output described as ±10 V peak corresponds to 20 Vpp. An output described as ±20 V peak corresponds to 40 Vpp. These conversions are mathematically correct, but neither should be presented as the definitive KVRZ-S output until KV HIPOT confirms which manual entry applies to the offered hardware and whether the value is specified open-circuit or into a defined load.
| Manual wording | Conditional Vpp conversion | Status for this article |
|---|---|---|
| Maximum peak amplitude ±10 V | 20 Vpp | Reported manual value; requires confirmation |
| Output amplitude ±20 V | 40 Vpp | Conflicting reported value; requires confirmation |
| Output impedance 50 Ω | Not a voltage value | Load condition must be defined when confirming amplitude |
IEC 60076-18 describes applying a low-voltage signal and sets requirements for measurement performance, but procurement should not reduce IEC conformity to one preferred Vpp value. The appropriate excitation must provide usable signal-to-noise performance without invalidating the measurement. A complete specification should identify waveform, adjustable levels, amplitude tolerance, distortion, behavior across frequency, and the impedance or termination at which the voltage is measured.
The most useful purchase-order wording is: “Supplier shall confirm the sinusoidal source output as Vpeak, Vpp, and Vrms; state whether each value is open-circuit or measured into the specified load; identify the adjustment range; and provide the applicable accuracy over frequency.” Until that confirmation is issued, the blog and quotation should avoid a single fixed KVRZ-S Vpp claim.
How Does Sweep Speed Affect Transformer Testing Efficiency?
Outage teams value speed, but an unrealistically fast claim can encourage technicians to reduce points, skip connection checks, or omit repeat measurements. A short acquisition is not efficient if questionable traces force the crew to reconnect the transformer or repeat the outage.
KVRZ-S states that one phase test takes less than 60 seconds and that high-, medium-, and low-voltage winding tests can be completed within 10 minutes. These are the defensible product figures; the original “under 20 seconds” claim is not supported by the supplied manual.
What determines the real time required on site?
Acquisition time is only one part of the job. The transformer must be de-energized, isolated, discharged, and safely earthed. External winding connections must be removed as required by the procedure. The technician must document tap position, temperature, bushing condition, lead routing, ground connection, and test configuration. A repeatability check should be made after disconnecting and reconnecting the leads, particularly when the result will become a future baseline.
| Workflow stage | Time driver | Efficiency safeguard |
|---|---|---|
| Safety and isolation | Site rules, discharge, permits | Never shorten safety controls to meet a sweep-time target |
| Test setup | Transformer configuration and access | Use labeled dedicated leads and a standard connection sheet |
| Sweep acquisition | Range, point count, resolution, averaging | Use the same settings for baseline and follow-up tests |
| Repeatability check | Reconnection and second sweep | Confirm that trace differences are not caused by the setup |
| Analysis | Baseline quality and comparison method | Compare with the same unit first, then phases or sister units when appropriate |
| Reporting | Metadata, curve export, file naming | Use consistent machine-readable data and back up original files |
The KVRZ-S uses DDS sweep technology, dual-channel 16-bit A/D conversion, automatic range and sampling adjustment, linear or segmented sweep, historical-curve comparison, automatic analysis, and Word report generation according to the manual. These functions can reduce operator workload. They do not replace engineering judgment: SFRA is primarily comparative, and a suspected deformation should be evaluated with transformer history and complementary electrical tests.
For buyers, the best efficiency acceptance test is a complete job simulation—not a stopwatch measurement of one sweep. Ask the supplier to configure the transformer record, connect the supplied leads, run all required phase/winding measurements, repeat one connection, compare traces, export the raw data, and generate a report. This reveals the real labor requirement and the quality of the final evidence.


 English
  ไทย
ไทย  Tiếng Việt
  العربية
  Русский
  Italiano
  Español
  한국어
한국어  Português do Brasil
  Français
  Español de México
  Português
  Türkçe
  Čeština
  Español de Argentina
  Slovenčina
  Dansk
Dansk  Polski
  Deutsch
  Ελληνικά
  O‘zbekcha
  Bahasa Indonesia
  Română