Mô tả
General Information
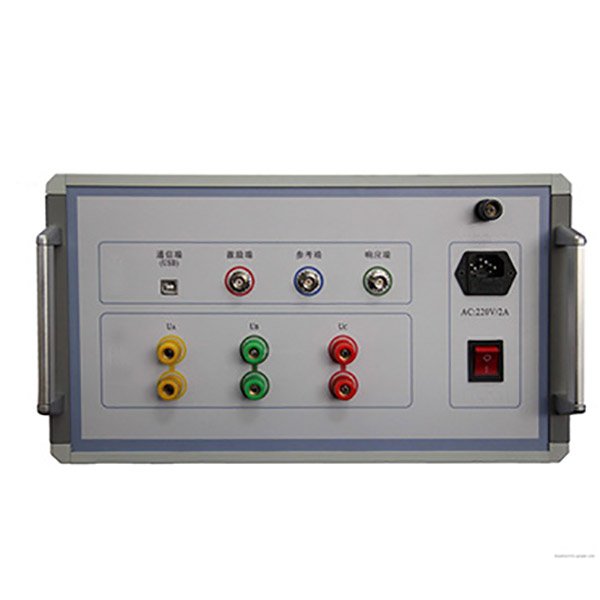
Power transformer winding deformation tester uses the internal fault frequency response analysis (FRA) method to measure the internal fault of transformer windings based on a measurement of the characteristics of transformer internal windings. This method can accurately identify transformer internal faults.
Main Tính năng
- Adoptshigh-speed, highly integrated microprocessor.
Communication USB interface used between a laptop and instrument.
3. Wireless WIFI interface (optional) used between the laptop computer and instrument. - Hardware adopts dedicated DDS digital high-speed scanning technology (USA), which can accurately diagnose the faults like winding distorted, bulged, shift, tilt, inter-turn short-circuit deformation and inter-phase contact short-circuit.
5. High-speed dual-channel 16-bit A/D sampling (in field test, move tap changer, and the wave curve shows obvious change) .
6. Signal output amplitude is adjusted by software, and the peak value of amplitude is ± 10V.
7. The computer will automatically analyze the test results and generate electronic documents (Word) - The instrument has dual measurement features: linear frequency scanning measurement and segment frequency scanning measurement, compatible with measurement mode of two technical groups in China
- The amplitude-frequency characteristics are in line with the national technical specifications on amplitude-frequency characteristics tester. X-coordinate (frequency) has linear indexing and logarithmic indexing, so you can print out the curve with linear indexing and logarithmic indexing. The user can choose either according to actual needs.
10. Automatic test data analysis system,
Compare between A, B, C -phases in winding similarity comparison, and
the analysis results are:
① excellent consistency
② good consistency
③ poor consistency
④ rather poor consistency
Compare winding deformation by calling the original data and comparing it with the current data of the same phase, namely A-A, B-B, C-C, and the analysis results are:
① normal winding
② mild deformation
③ moderate deformation
④ severely deformation
- Word electronic document can be automatically generated for saving and printing.
Technical parameters
Scan mode:
1. Linear scanning distribution
Scanning measurement range: (10Hz) – (10MHz) 40000 scanning point, resolution 0.25kHz, 0.5kHz and 1kHz
2. Segment frequency scanning measurement distribution
Frequency scanning measurement range: (0.5kHz) – (1MHz), 2000 scanning points ;
(0.5kHz) – (10kHz)
(10kHz) – (100kHz)
(100kHz) – (500kHz)
(500kHz) – (1000kHz)


