

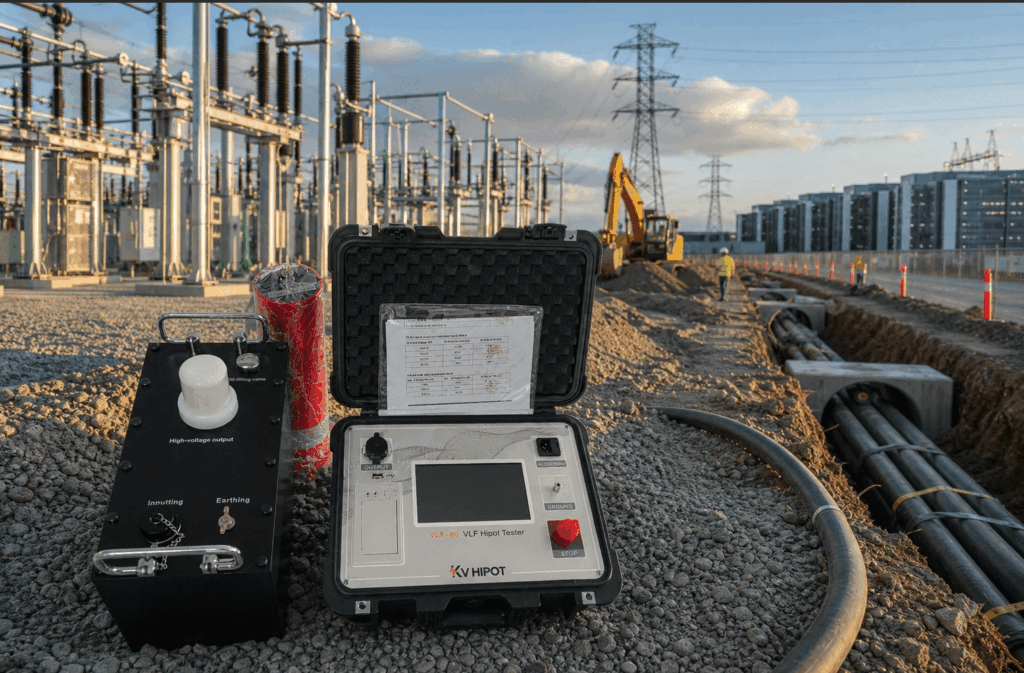
Undersized VLF testers trip mid-test, halting commissioning and risking costly downtime. Choosing the right specifications ensures reliable cable withstand testing without operational bottlenecks.
A VLF hipot tester’s performance depends on continuous capacitive load capability (µF at 0.1 Hz), peak/RMS test voltage, sine waveform purity, measurement resolution, auto-frequency tuning, and integrated discharge systems. Continuous load driving capacity directly limits testable cable length.
How do you select the required peak test voltage (kV peak / kV RMS) for your cable rating?
Applying incorrect test voltages risks catastrophic cable punctures or fails to expose critical insulation water trees. Selecting voltages without understanding peak versus RMS values compromises commissioning. Match your tester’s output directly to IEEE 400.2 test categories and operating parameters.
VLF withstand testing applies significantly higher electrical field stress than nominal AC line frequency to trigger treeing breakdown without initiating harmful space-charge accumulation typical of DC testing. Standards like IEEE 400.2 define test voltage tiers based on the cable’s nominal phase-to-phase rating across three distinct test categories: installation (acceptance testing of newly laid cable), after-repair, and periodic maintenance.
Understanding Peak Voltage (V peak) vs. RMS Voltage (V RMS)
Peak voltage (V peak, or kV peak) defines the maximum instantaneous electrical potential reached at the crest of the AC waveform. In high-voltage cable withstand testing, electrical breakdown across insulation defects (like voids or water trees) is triggered by this extreme voltage crest, not the average heat equivalent. For this reason, international standards such as IEEE 400.2 define pass/fail withstand levels primarily in peak kilovolts.
In contrast, RMS voltage (V RMS, Root Mean Square) represents the effective heating value of the alternating waveform. For a pure sinusoidal wave:
Peak voltage = √2 × RMS voltage ≈ 1.414 × RMS voltage
RMS voltage = Peak voltage ÷ √2 ≈ 0.707 × Peak voltage
For cosine-rectangular waveforms, peak and RMS values are identical.
A dangerous procurement mistake occurs when equipment nameplates label output simply as ‘voltage’ without specifying whether it denotes V peak or V RMS. For example, a tester rated for 34 kV peak outputs only 24 kV RMS. If a project specification mandates 34 kV RMS, using that 34 kV peak unit severely under-tests the cable, failing to uncover fatal defects before energization. Conversely, applying 34 kV RMS when 34 kV peak was intended over-stresses insulation by 41%, risking permanent dielectric rupture.
| Cable System Rating (Phase-to-Phase) | IEEE 400.2 Installation (V RMS) | IEEE 400.2 Installation (V peak) | Maintenance Test (V RMS) | Maintenance Test (V peak) |
|---|---|---|---|---|
| 5 kV | 9 kV | 13 kV | 7 kV | 10 kV |
| 15 kV | 22 kV | 31 kV | 16 kV | 23 kV |
| 25 kV | 33 kV | 47 kV | 24 kV | 34 kV |
| 35 kV | 47 kV | 66 kV | 34 kV | 48 kV |
Always check the tester nameplate: verify if maximum kV output is expressed in peak (kV peak) or root-mean-square (kV RMS) to ensure compliance with field testing standards. For 35 kV distribution networks, equipment rated for at least 66 kV peak (approximately 47 kV RMS sine wave) is mandatory to perform standard-compliant acceptance tests.
What maximum capacitive load (microfarads, µF) must the VLF tester drive at 0.1 Hz, 0.05 Hz, and 0.02 Hz?
Buying a VLF tester based only on output voltage leads to sudden shutdown on long cable circuits. Cable capacitance overloads undersized power supplies instantly. Verifying rated load capacity across 0.1 Hz, 0.05 Hz, and 0.02 Hz guarantees uninterrupted testing on long feeder runs.
When evaluating technical specifications, the critical sizing parameter is not maximum open-circuit output voltage, but continuous capacitive load capability (rated in microfarads, µF) at 0.1 Hz. Long medium-voltage cable runs represent substantial capacitive loads (C = Q ÷ V); typical shielded XLPE and EPR power cables exhibit capacitances between 0.15 µF/km and 0.35 µF/km per phase.
Charging and discharging this distributed capacitance at 0.1 Hz demands high reactive power (Q = 2 × π × f × C × V²). If a VLF unit is rated for 34 kV at 0.1 Hz but only supports 0.5 µF, it cannot test long feeder circuits or all three phases bundled together without overloading its inverter and tripping offline on thermal overcurrent.
To overcome power limitations when testing long circuits, VLF testers utilize frequency step-down derating:
| Output Frequency | Cycle Duration | Capacitive Drive Multiplier | Operational Impact |
|---|---|---|---|
| 0.10 Hz | 10 seconds | 1.0 × (Base rating) | IEEE preferred frequency for withstand and Tan Delta |
| 0.05 Hz | 20 seconds | 2.0 × base capacity | Doubles withstand duration; tests medium-length feeders |
| 0.02 Hz | 50 seconds | 5.0 × base capacity | Multiplies test duration; necessary for long substation ties |
Always confirm the manufacturer’s maximum µF load rating across all selectable frequencies. A high base capacitance rating at 0.1 Hz ensures tests finish within the standard 15 to 30 minutes, preventing operational bottlenecks.
How does output waveform purity (pure sine wave vs. square wave) impact Tan Delta diagnostic accuracy?
Relying on distorted waveforms creates inaccurate diagnostic data, disguising severe insulation defects. Harmonics and steep wave fronts generate false leakage readings that ruin dielectric analysis. Selecting a true sine wave source ensures repeatable Tan Delta measurements and standard compliance.
VLF instruments generate high-voltage output using either pure sine wave inverter technology or cosine-rectangular (square/trapezoidal) switching. While cosine-rectangular units provide simple go/no-go withstand stress with lower power consumption, they fail when deployed for precision diagnostic testing such as Dissipation Factor (Tan Delta / tan δ) and Partial Discharge (PD).
Impact on Tan Delta Loss Angle Analysis
Tan Delta evaluates dielectric degradation by measuring the phase difference (δ) between applied sinusoidal voltage and resultant leakage current (I capacitive + I resistive). A true sinusoidal excitation produces a steady, single-frequency response where dielectric loss is expressed as:
tan δ = I resistive ÷ I capacitive = 1 ÷ (2 × π × f × R × C)
Cosine-rectangular waveforms switch polarity rapidly with high dV/dt transitions. These steep edges inject high-frequency harmonic components into the cable dielectric, altering polarization loss and rendering mathematical phase shift calculations invalid.
Why Waveform Purity Dictates Diagnostic Validity
- Harmonic Distortion: Pure sine wave units maintain total harmonic distortion (THD) below 5%, ensuring linear dielectric polarization matching IEEE 400.2 benchmarking criteria.
- Partial Discharge Inception: High dV/dt edges from non-sinusoidal units cause premature local breakdown at void sites, preventing accurate PD inception voltage (PDIV) determination.
- Reproducibility Across Fleets: Testing historical trends requires standard 0.1 Hz sinusoidal excitation; non-sinusoidal data cannot be cross-referenced against IEEE stability brackets (e.g., Mean Tan Delta, Differential Tan Delta / Delta-TD).
What voltage and leakage current measurement resolutions are required for precision logging?
Low-resolution metering conceals micro-amp insulation degradation, letting developing water trees slip through commissioning undetected. Inaccurate instrumentation results in false passes or unnecessary cable replacements. Demanding true sub-microamp current and kilovolt resolution provides actionable health diagnostics.
Precision logging transforms a simple withstand test from an unmonitored stress event into an analytical condition assessment tool. During high-voltage VLF excitation, the instrument’s internal acquisition system must separate massive capacitive charging currents (often dozens of milliamperes) from minuscule resistive leakage currents indicative of water treeing, thermal oxidation, or moisture ingress.
If current metering resolution is limited to 0.1 mA (100 µA), subtle insulation leakage anomalies remain entirely invisible until full dielectric rupture occurs. High-performance field instruments incorporate 16-bit to 24-bit analog-to-digital converters (ADCs) capable of 1 µA or sub-microamp resolution. Voltage measurement must simultaneously track peak and true RMS values with at least 0.1 kV resolution and ±1% accuracy to prevent accidental over-stressing of aged polymer jackets.
| Parameter | Minimum Requirement | Precision Specification | Engineering Importance |
|---|---|---|---|
| Output Voltage Resolution | 1.0 kV | 0.1 kV | Prevents voltage overshoot beyond IEEE limits |
| Leakage Current Resolution | 10 µA | ≤ 1 µA (0.1 µA ideal) | Isolates resistive degradation from capacitive current |
| Voltage Metering Accuracy | ±3% of full scale | ±1% of reading | Ensures reproducible field calibration |
| Current Metering Accuracy | ±5% | ±1.5% to 2% | Enables trending of aging insulation over multi-year cycles |
| Sampling Rate | 1 kS/s | ≥ 10 kS/s | Captures transient breakdown events and micro-arcs |
Real-time automated logging of these metrics allows technicians to observe current trends over the standard 15- to 60-minute withstand duration. A rising leakage current at constant test voltage signals imminent dielectric thermal runaway.
How does automatic frequency tuning prevent equipment overloading on long cable runs?
Manual frequency selection invites operator error, triggering internal thermal overloads or incomplete test cycles on massive cable lengths. Unbalanced capacitive loading can damage tester power electronics. Intelligent automatic frequency tuning optimizes output dynamically to protect both instrument and circuit.
When testing complex distribution networks, actual circuit capacitance often deviates from single-cable engineering estimates due to intermediate splice joints, parallel branches, and variable installation depths. If an operator forces a fixed 0.1 Hz frequency on a heavily loaded circuit exceeding the tester’s current ceiling, the power supply will overheat, fold back voltage, or trip offline mid-cycle.
Real-Time Impedance Sensing
Modern VLF testers incorporate intelligent microprocessor-controlled tuning circuits. Upon initiating the test sequence, the system emits a low-voltage diagnostic pulse to measure the load’s complex impedance (Z load) and calculate equivalent capacitance (C).
Adaptive Frequency Selection
Based on the measured microfarads, the control algorithm automatically adjusts output frequency:
- Optimal Operation (0.1 Hz): If load capacitance is within the 0.1 Hz continuous rating, testing commences at standard frequency.
- Dynamic Step-Down (0.05 Hz to 0.01 Hz): If capacitance exceeds the 0.1 Hz limit, the unit automatically scales frequency down to 0.05 Hz, 0.02 Hz, or 0.01 Hz, expanding capacitive drive capability up to tenfold while maintaining the required test voltage.
- Thermal Protection: By restricting output current to safe continuous operating boundaries, automatic tuning prevents inverter IGBT overheating and protects internal high-voltage transformers from saturation without manual operator guesswork.
What internal safety discharge systems and ground monitoring interlocks must be integrated?
Residual capacitive charges on high-voltage cables present lethal shock hazards to testing crews after shutdown. Inadequate grounding protection risks severe arc flash and equipment destruction. Robust internal discharge systems and continuous ground interlocks ensure absolute operator safety under field conditions.
High-voltage cable systems act as massive energy storage capacitors (E = ½ × C × V²). After completing a 34 kV or 60 kV VLF test, a medium-voltage feeder can retain lethal energy long after the primary generator powers down. Furthermore, polymeric dielectrics exhibit dielectric absorption (charge recovery), causing voltage to rebound if a disconnected cable is not continuously grounded.
A professional VLF system must integrate a dual-stage, fail-safe discharge architecture. The first stage employs an internal, heavy-duty resistive discharge solenoid that actively absorbs energy in a controlled decay cycle upon test completion or sudden power loss. The second stage automatically drops a direct mechanical grounding switch onto the high-voltage bus once voltage drops below safe thresholds.
| Safety Feature | Operating Mechanism | Operational Risk Mitigated |
|---|---|---|
| Automatic Discharge Resistor | Internal ceramic/wirewound resistor bank (e.g., 10–20 kJ rated) | Dissipates stored capacitive charge safely without arcing |
| Mechanical Shorting Solenoid | Gravity-assisted or spring-loaded mechanical contactor | Grounds the HV output terminal if main power fails |
| Ground Loop Interlock (F-Ground) | Continuous impedance sensing between chassis and earth ground | Inhibits high-voltage generation if protective earth is disconnected |
| Emergency Stop & Interlock Key | Hardwired manual switch and external interlock loop | Instantaneously halts inverter drive and trips discharge |
| Zero-Start Interlock | Rotary encoder / digital threshold check | Prevents high-voltage initiation unless regulator starts from zero |
Testers operating in rugged utility environments must never rely solely on external manual discharge sticks; integrated automated systems are essential for zero-incident safety compliance.
VLF hipot 테스터를 평가하기 위해서는 더 열린 회로 상태 테스트 전압보다 지속적인 용량성 부하 용량(0.1 Hz의 µF)을 우선시해야 합니다. 필수 IEEE 400.2 내성 수준을 순수 사인파 형태의 순도, 정밀 전류 분해능, 자동 주파수 적응 기능 및 고장 방지 방전 시스템으로 맞추십시오. 구매하기 전에 제조업체의 부하 감축 곡선을 가장 긴 설치된 케이블 회로와 비교하여 확인하여 안정적인 현장 성능을 보장하십시오.


 English
  ไทย
ไทย  Tiếng Việt
  العربية
  Русский
  Italiano
  Español
  한국어
한국어  Português do Brasil
  Français
  Español de México
  Português
  Türkçe
  Čeština
  Español de Argentina
  Slovenčina
  Dansk
Dansk  Polski
  Deutsch
  Ελληνικά
  O‘zbekcha
  Bahasa Indonesia
  Română